Today, right before a client meeting, I was asked to determine whether the client’s drop in overall membership was due to the drop in spouses on the plan.
I thought this would be a good time to practice learning some newly acquired stats skills. Here is the original data that sparked the question:
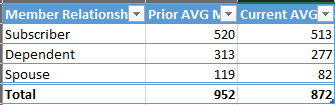
I first asked myself the question what types of variables I am analyzing. Initially I was confused by the notion that these were “averages”, and struggled to find out how to test them. After some more thought, I realized I was looking at categories and what I’m actually testing are the proportions between them… categorical variables (I’m very new to this :D)!
This can be tested with the Two-sample Z-Test for Proportions.
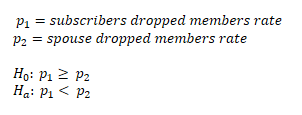
The null hypothesis is that the the proportion of the dropped members of the subscriber population is equal or greater than the proportion of the spouse population. The alternative hypothesis is that the subscriber dropped members are less than the spouse dropped members.
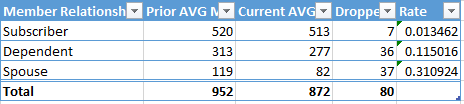
The first step is to calculate the rate. I did this by dividing the dropped members against their prior average.
Next step is to set the alpha level and critical value. The alpha level is set to 0.05, and since this is a one-sided hypothesis, the critical value is 1.645.
Next is to determine the Z statistic, which can be determined by the Two-sample Z-Test:
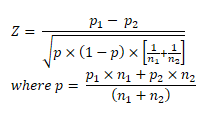
I’ll first calculate p using the numbers in the data.
I did this on paper and came up with p = 0.058. Next I’ll calculate Z = -12.5526.
Next I’ll determine we reject the null hypothesis if the z statistic is less than the critical value. Since -12.5526 is less than 1.645, we can reject the null hypothesis and conclude that the proportion of spouses who dropped from the plan is a greater contributing factor to the overall drop rate than the subscribers who dropped from the plan.

Leave a comment