As a way to help me learn how to analyze healthcare data, I am practicing equations on simple datasets. This dataset is sourced from data.cms.gov and updated on June 5, 2021: https://data.cms.gov/provider-data/search?theme=Physician%20office%20visit%20costs. Medicare compiles this data from their procedure lookup tool.
The data sets contains US zip codes, minimum, maximum and mode Medicare charges for new and established patients, most utilized codes for new and established patients, and minimum, maximum and mode copay for new and established patients.
First thing we want to do is identify the zip codes by US state. Zip code data was sourced from simplemaps.com and updated on August 10, 2021: https://simplemaps.com/data/us-zips. I then performed a VLOOKUP to match the zip codes to the state on the referenced datasets. There are 42,956 zip codes on the CMS data file, and I was able to match 33,122. That is a 77% capture rate, and since we have all 50 plus 6 territories, and since I am doing this while I’m eating lunch, I am going to say that accomplishes our purpose.
The next step is to find the min, max, and mode for all fields in each state. After about an hour (the length of time was determined by the cold temperature of my leftover lunch particles) and many failed attempts and Google searches, I developed the below formula (and I exclaimed with joy and hugged and kissed my dog when I finally did it!!). This is an array formula that returns the min, max, or mode of a given range where we are testing that the value provided (the state) matches the state in the table. I created three different variations of the formula for MIN, MAX, and MODE.


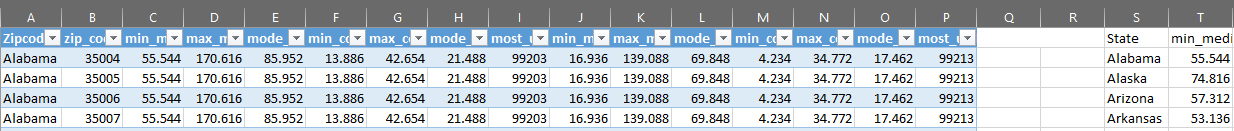
I copied this formula over the rest of the fields to find the minimum of each minimum by state, maximum of each maximum by state, and mode of each state for Medicare payment and member copayment of new and established patients.
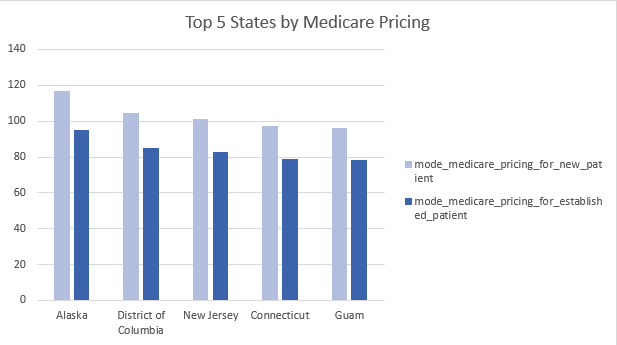
Now that we have combined and cleaned our data, we can do some analysis. When sorted by the mode for highest Medicare payment by state, Alaska, District of Columbia and New Jersey are the top 3.
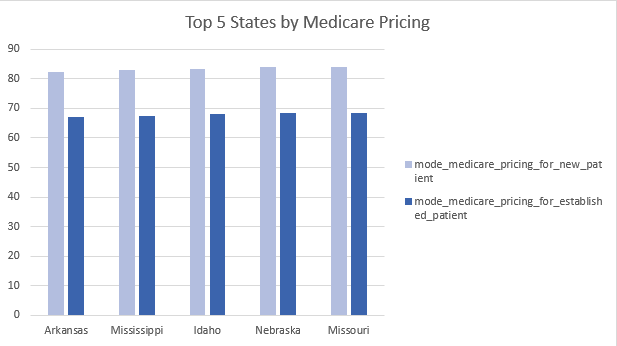
Arkansas, Mississippi and Idaho are the bottom 3:
Medicare physician payments are calculated by multiplying RVUs by GCPIs by the conversion factor. As the RVUs are consistent by CPT code (99203 in this example), our variable is GPCI. GPCIs for 2021 are sourced from CMS:

As this reaches the limit of my presumed knowledge, we will pick this up another time to find what the relationship is between the GCPI and Medicare payment between the highest and lowest states.

Leave a comment